
Annual reports, white papers, and ESG documents — rebuilt from cluttered exports into publication-grade design. See the before and after for yourself.
Three projects. Drag any slider to see the before and after — then explore the full build below.
103-page institutional report · Full data-viz overhaul · Print + Digital
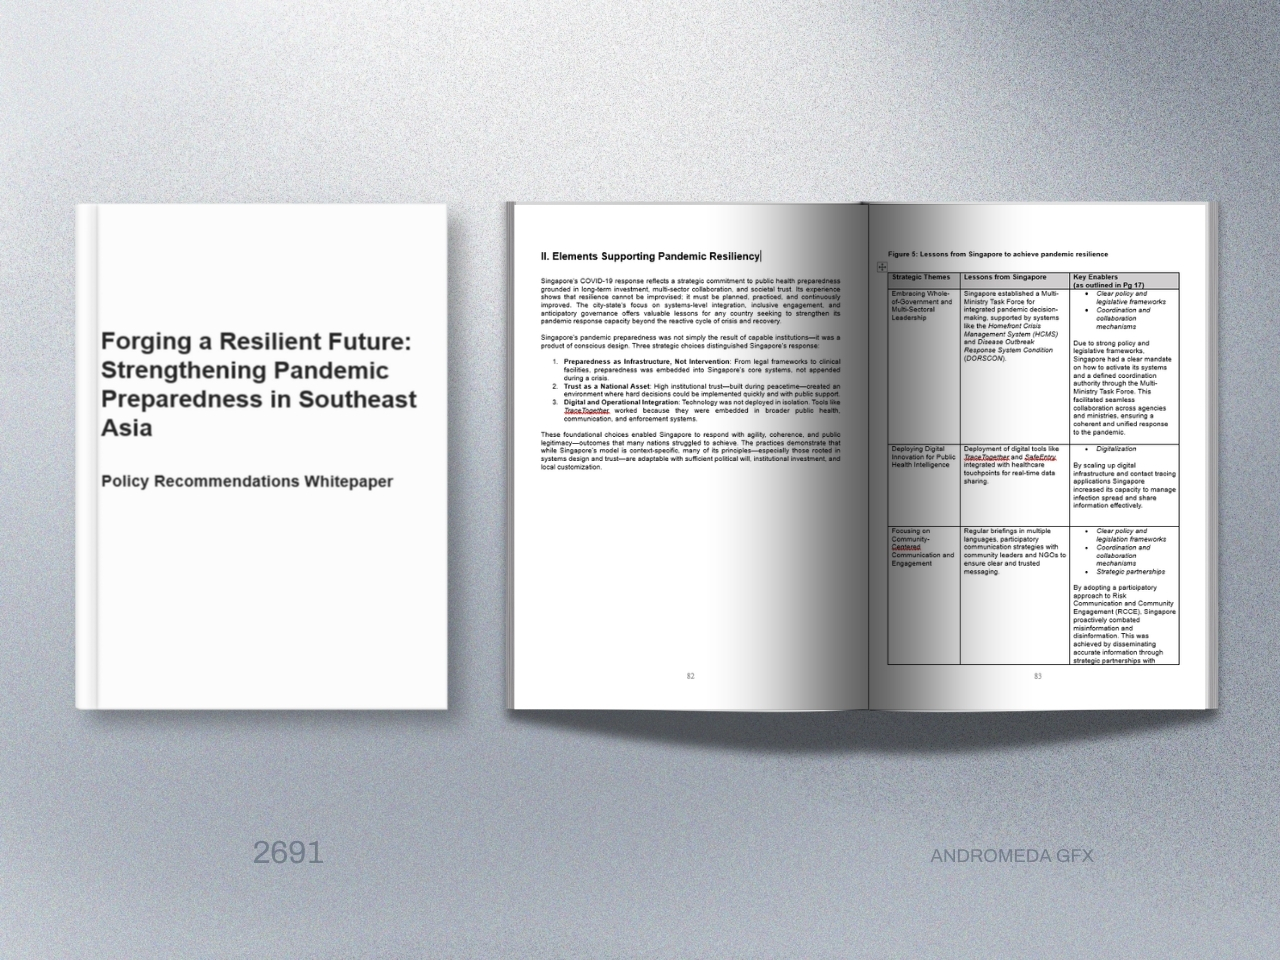
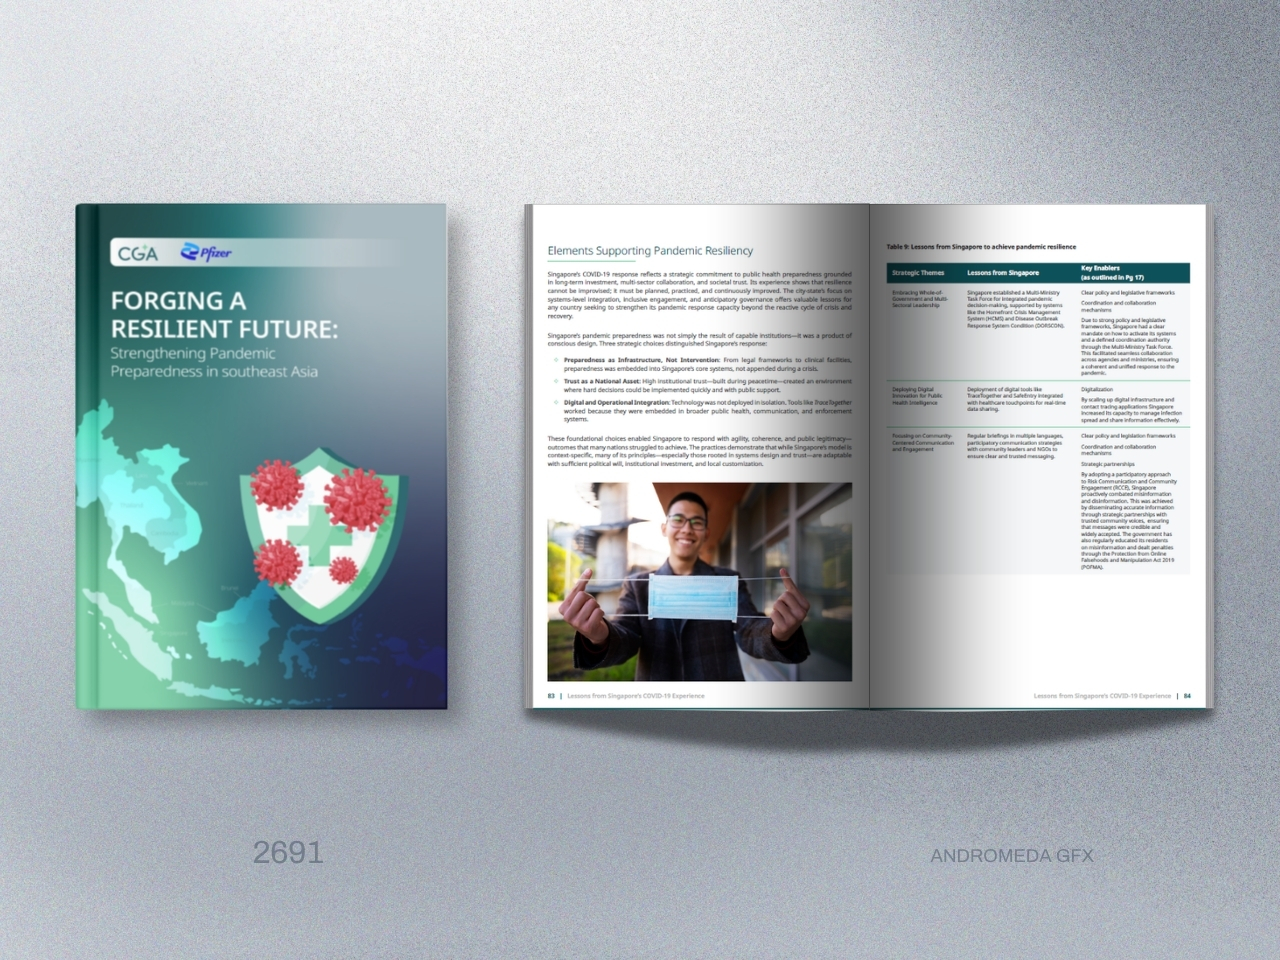
A 103-page Word export rebuilt as a publication-grade report.
The source material carried complex pandemic-preparedness research, country-level recommendations, workshop insights and regional policy guidance.
Our role was to turn that dense content into a clear, professional whitepaper that could be confidently shared with government stakeholders, health-sector partners and institutional audiences.
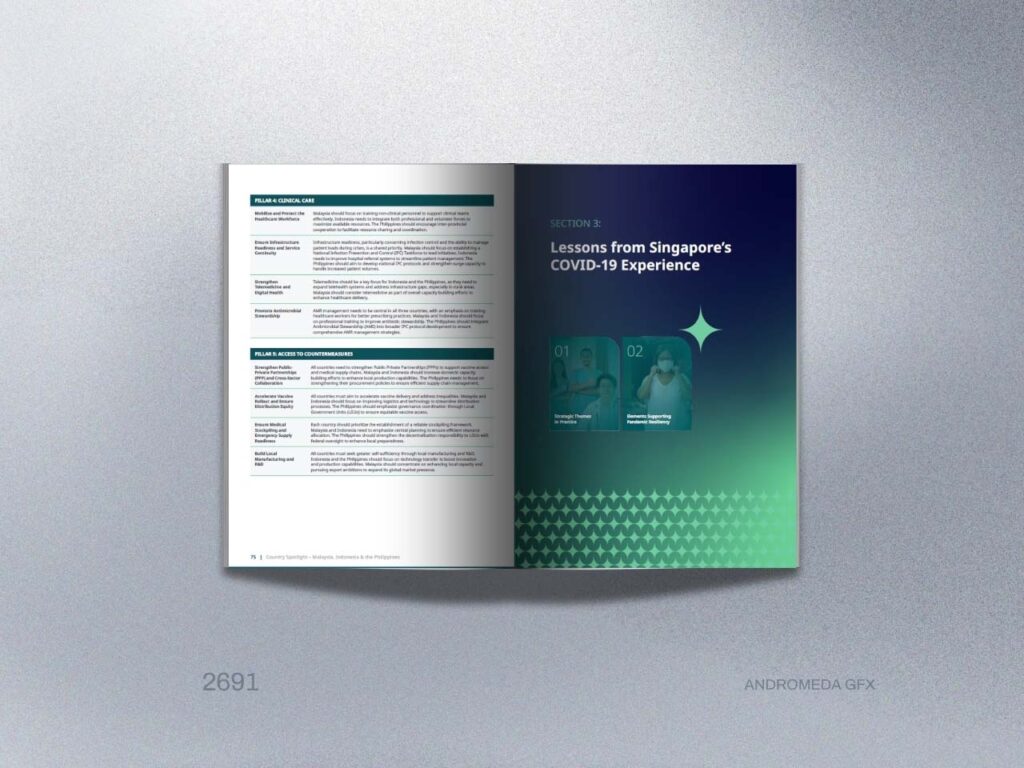
The report included heavy multi-column recommendation matrices covering emergency coordination, collaborative surveillance, community protection, clinical care and access to countermeasures across Malaysia, Indonesia and the Philippines.
We rebuilt these dense tables into clean, branded layouts with consistent spacing, hierarchy, country identifiers, visual structure and readable formatting — transforming policy-heavy information into designed evidence pages that felt intentional rather than exported.
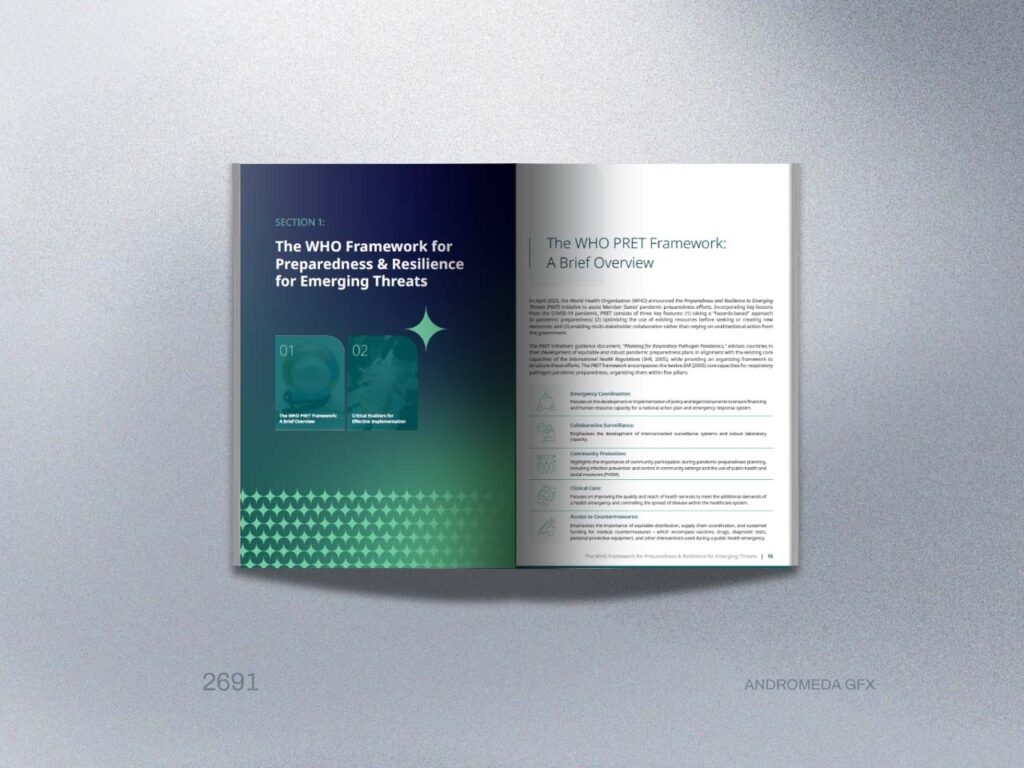
The final report was delivered as a fully designed, publication-ready whitepaper with a professional cover, executive summary, table of contents, abbreviations, methodology, country sections, visual tables, recommendations, conclusion and bibliography.
The result was a clean, credible and stakeholder-ready document that balanced corporate polish with public-health seriousness, suitable for both formal distribution and digital portfolio presentation.
“The report finally reflected the quality of the research inside. Our investors commented on the presentation before they even got to the content.”
Client Name
Director of Strategy, Organisation Name
73-page white paper · Full typesetting · Reusable template system
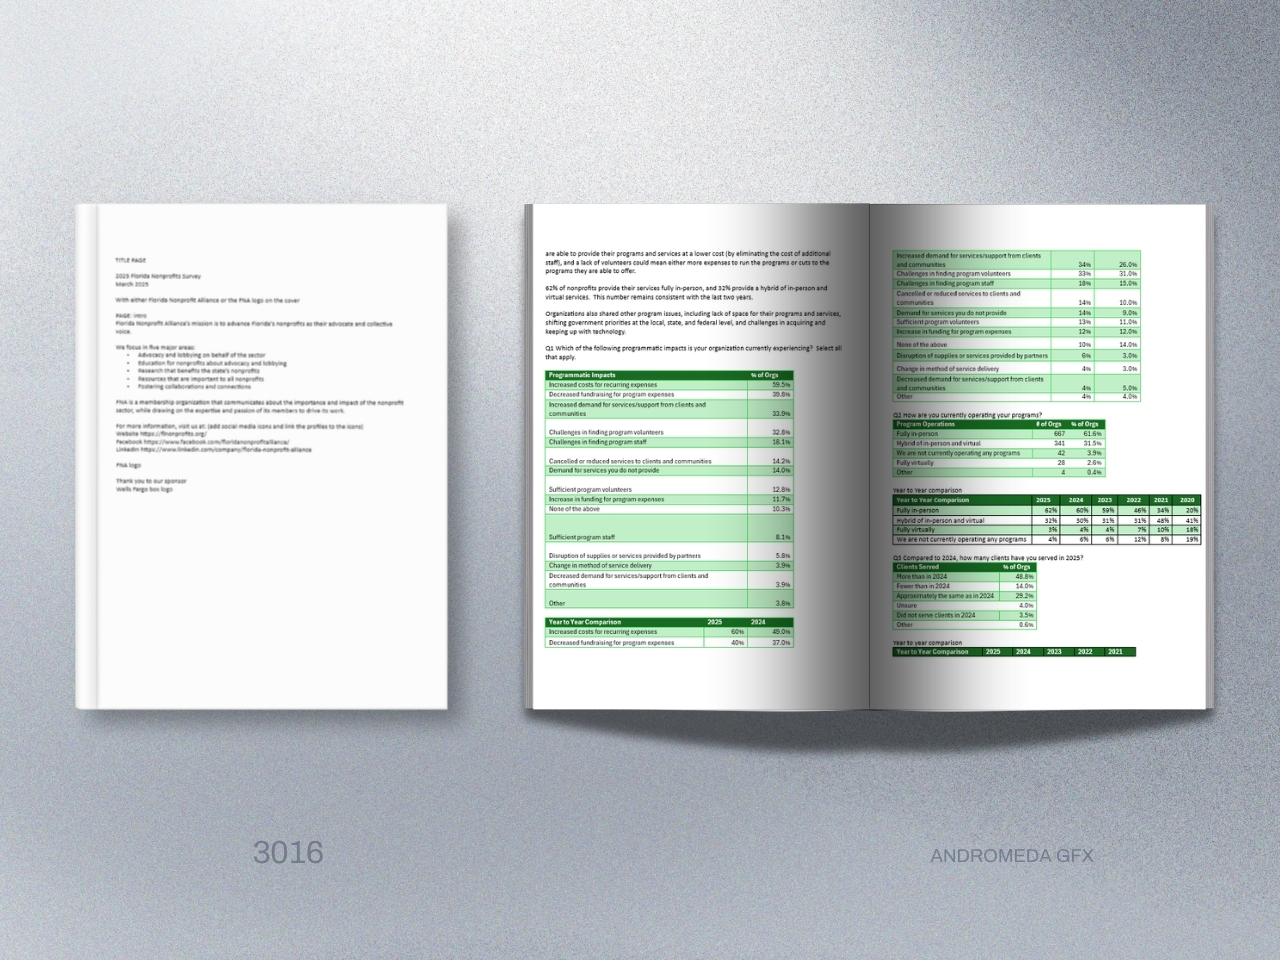
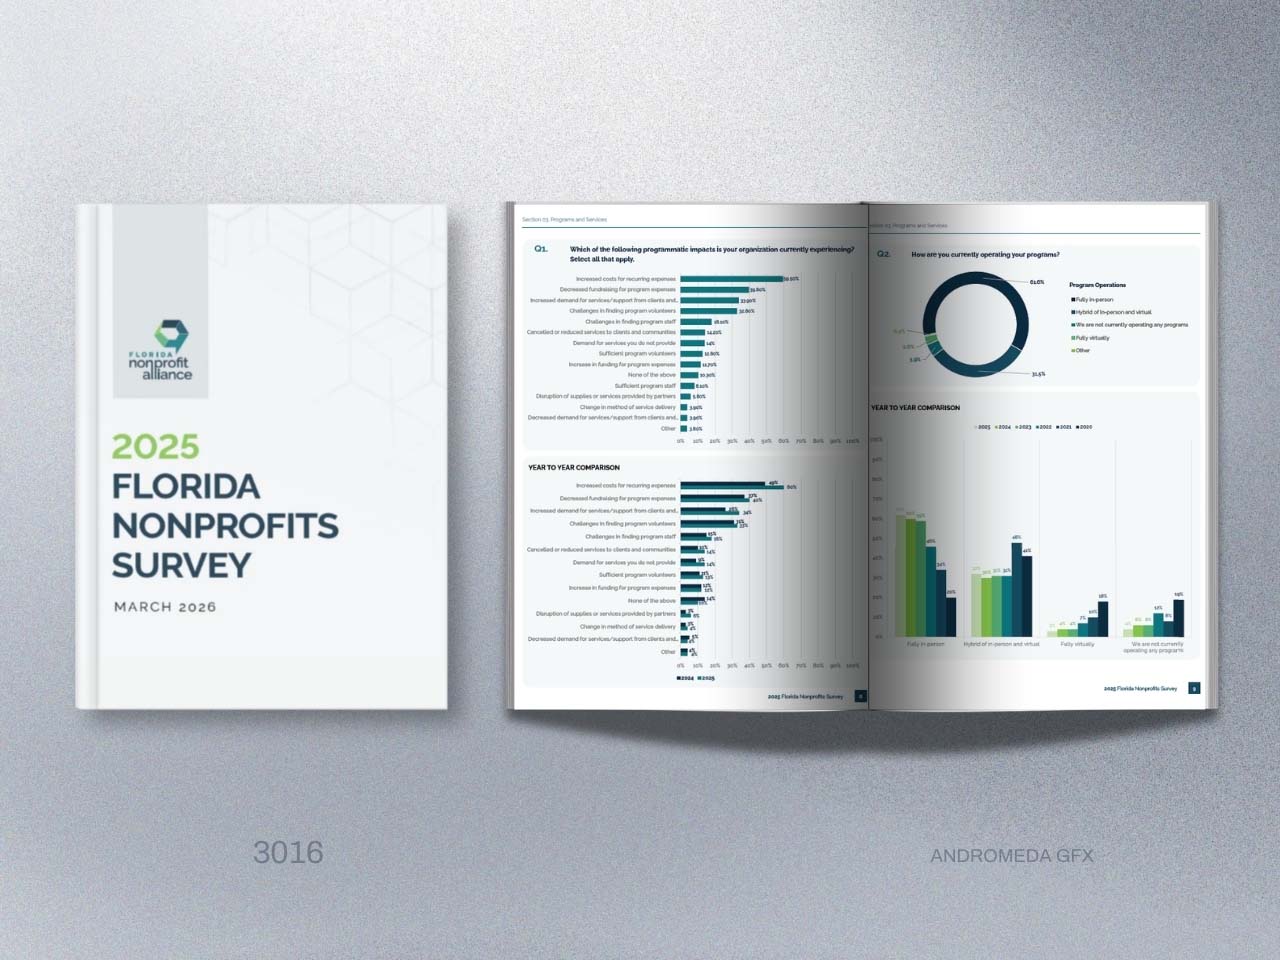
A flagship white paper redesigned into a repeatable quarterly system.
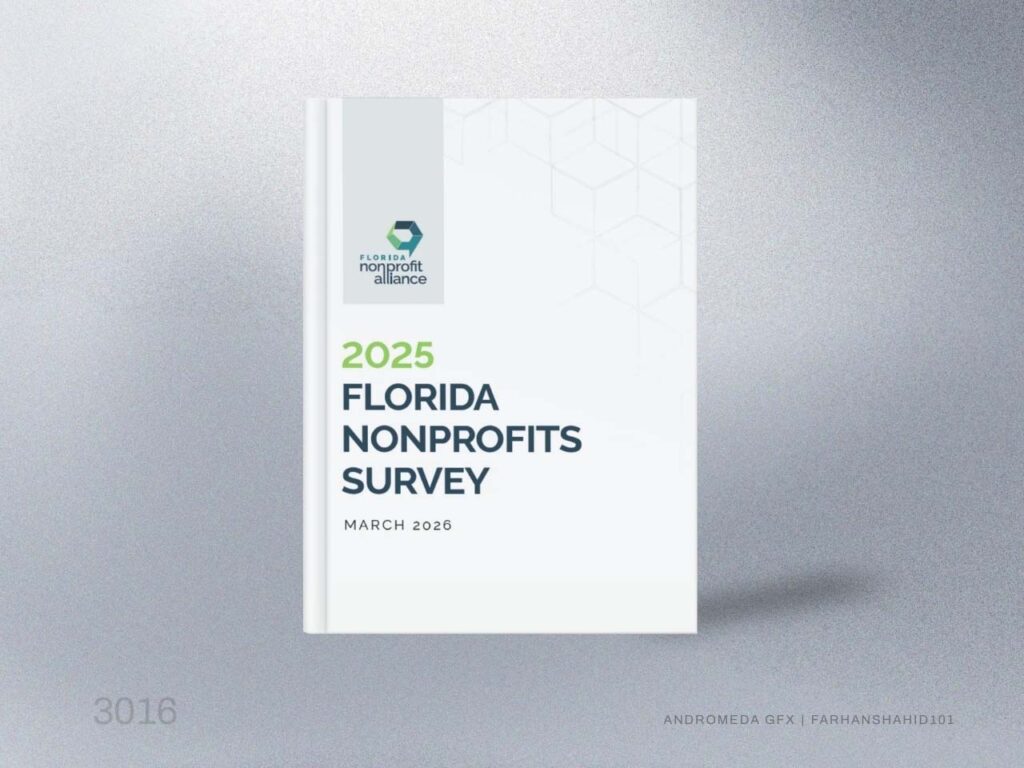
The original report needed to move beyond a standard internal document and become a polished, public-facing research publication for Florida’s nonprofit sector.
We transformed the survey findings into a credible market intelligence report with a stronger editorial structure, clearer visual hierarchy and a more professional brand presence — suitable for public release, stakeholder sharing and future annual editions.
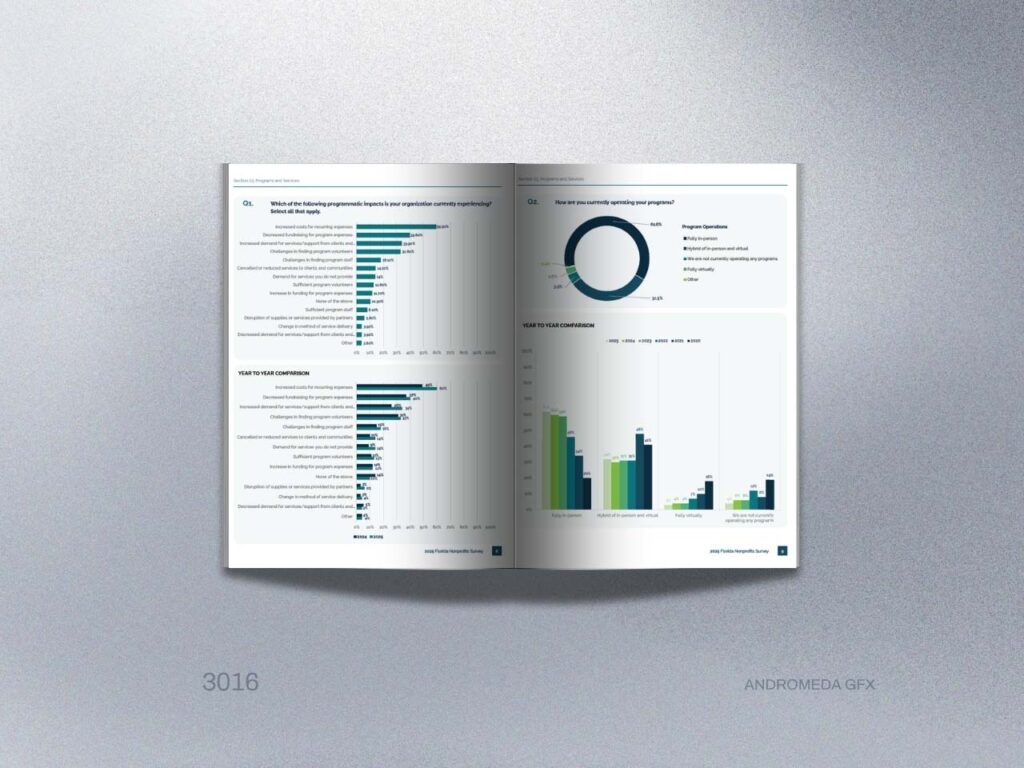
Because this survey is part of an ongoing reporting series, the design needed to work beyond one document. We built a flexible layout system that could handle section openers, executive summaries, methodology pages, data-heavy spreads, charts, tables and respondent demographics.
This gave the client a consistent visual language for long-form research while keeping future editions easier to update, expand and produce.
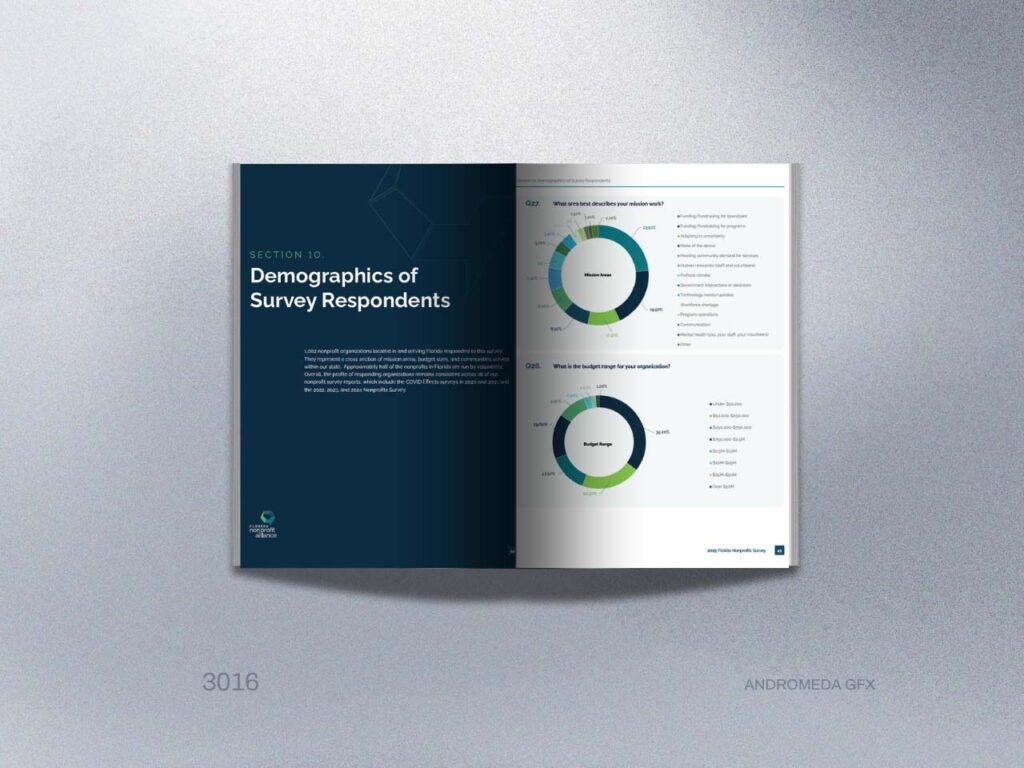
The final deliverable was a complete, branded research report with a professional cover, table of contents, section openers, chart pages, summary pages and regional analysis.
The finished publication gave Florida Nonprofit Alliance a stronger, more authoritative report format — one that communicates sector-wide challenges clearly while reinforcing the organization’s role as a trusted voice for Florida nonprofits.
“We’ve used the template for three quarterly reports since. It saves us days of production time and the output is consistently professional.”
Client Name
Head of Research, Firm Name
32-page ESG report · Infographic-heavy · Print + interactive PDF
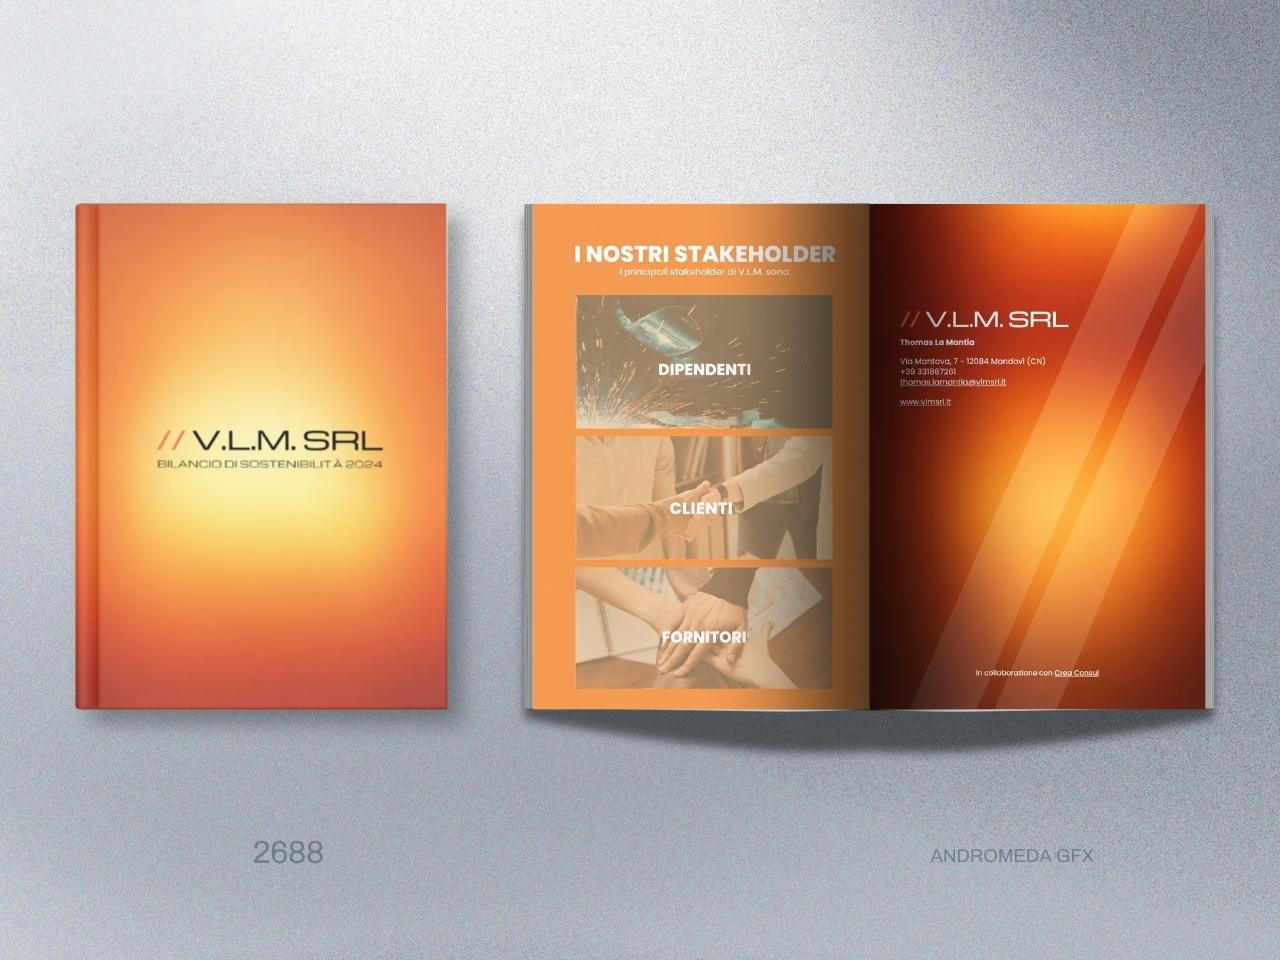
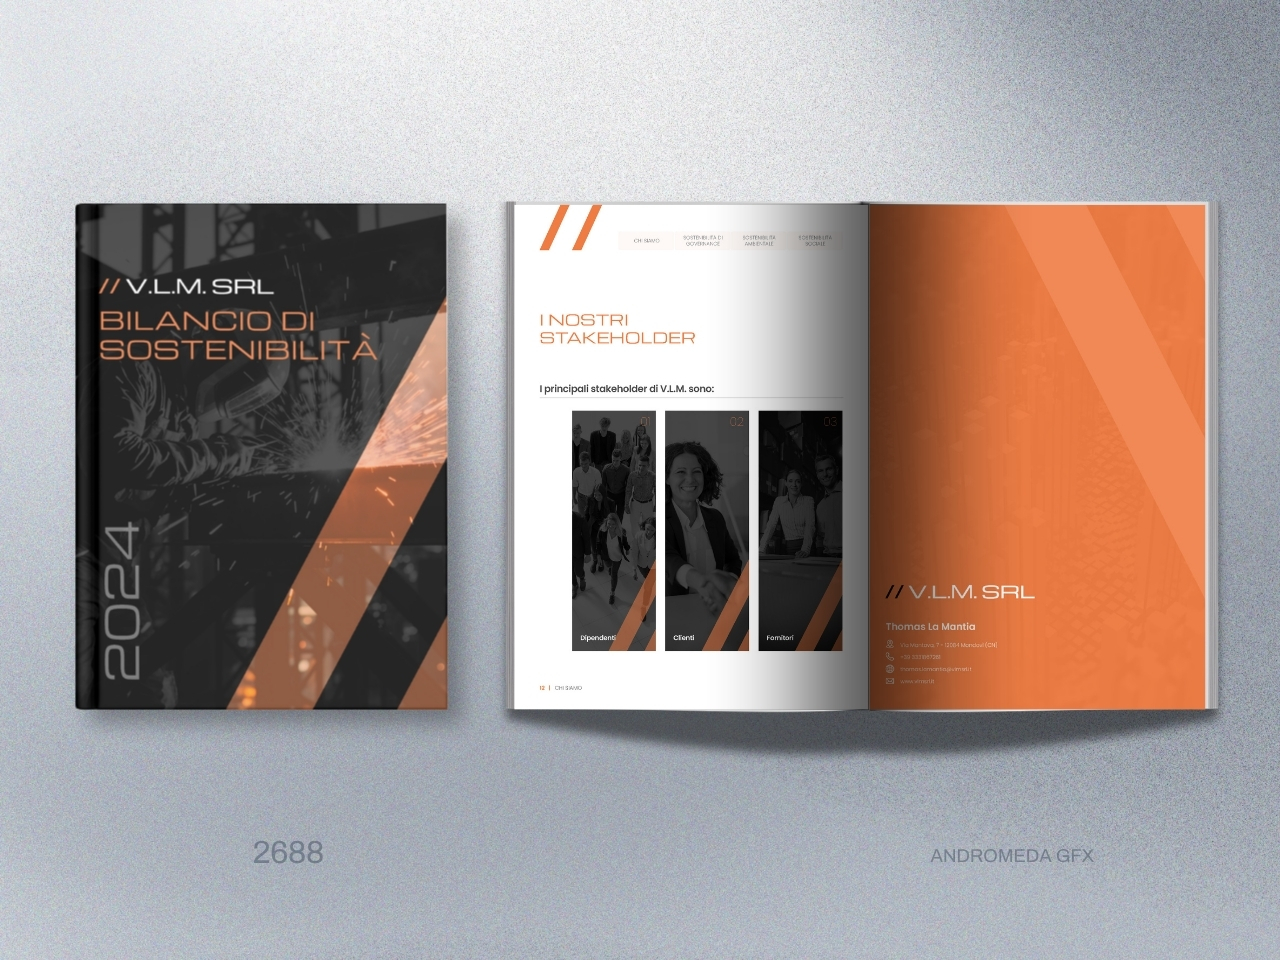
Four source formats consolidated into one publication-grade ESG report.
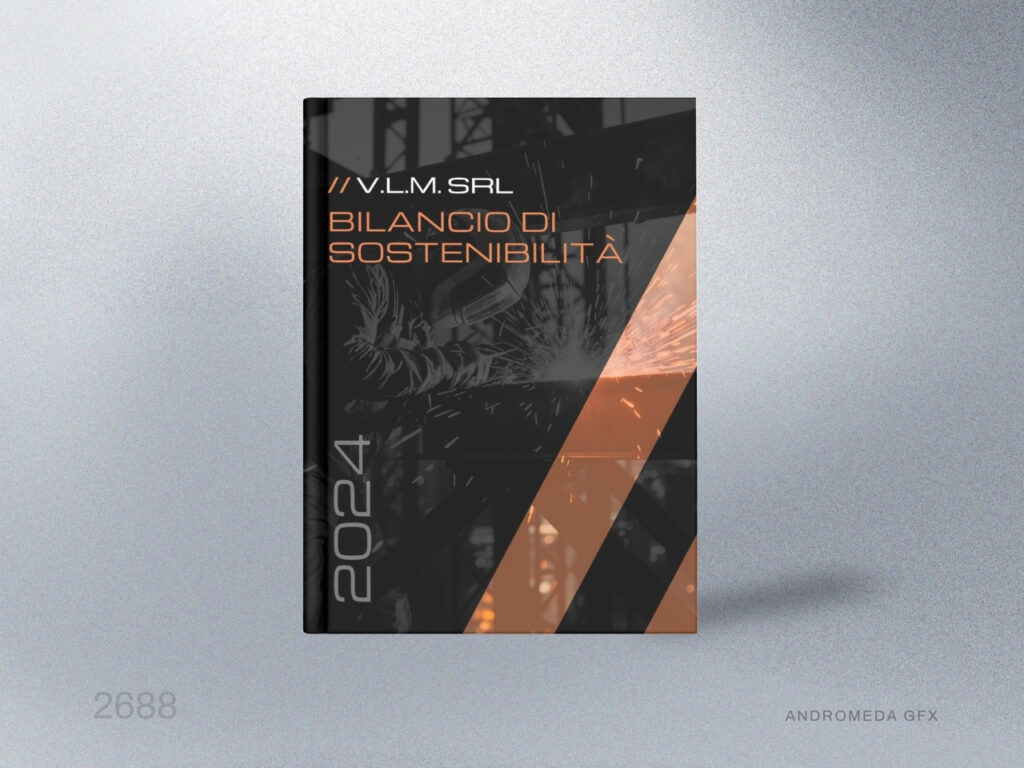
The client needed a polished sustainability report that could bring together company information, ESG commitments, environmental data, social impact, governance details and GRI references into one clear publication.
We structured the content into a professional report format with a strong cover, organized contents, stakeholder letter, sustainability sections and supporting visuals, creating a document that felt credible, complete and ready for external presentation.
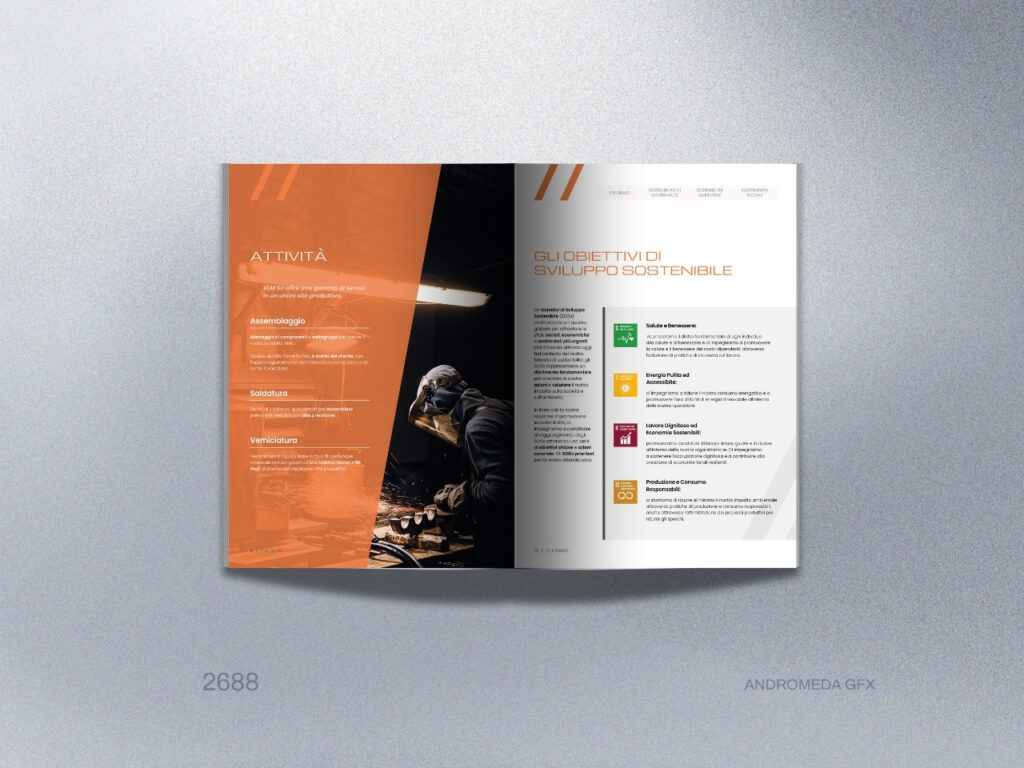
The report included several important sustainability metrics, from renewable energy use and workplace safety to revenue, team size, economic value and stakeholder mapping.
We translated these numbers into clean, branded infographic pages using icons, percentage blocks, timelines and visual callouts to make the ESG data easier to understand and more engaging for readers.
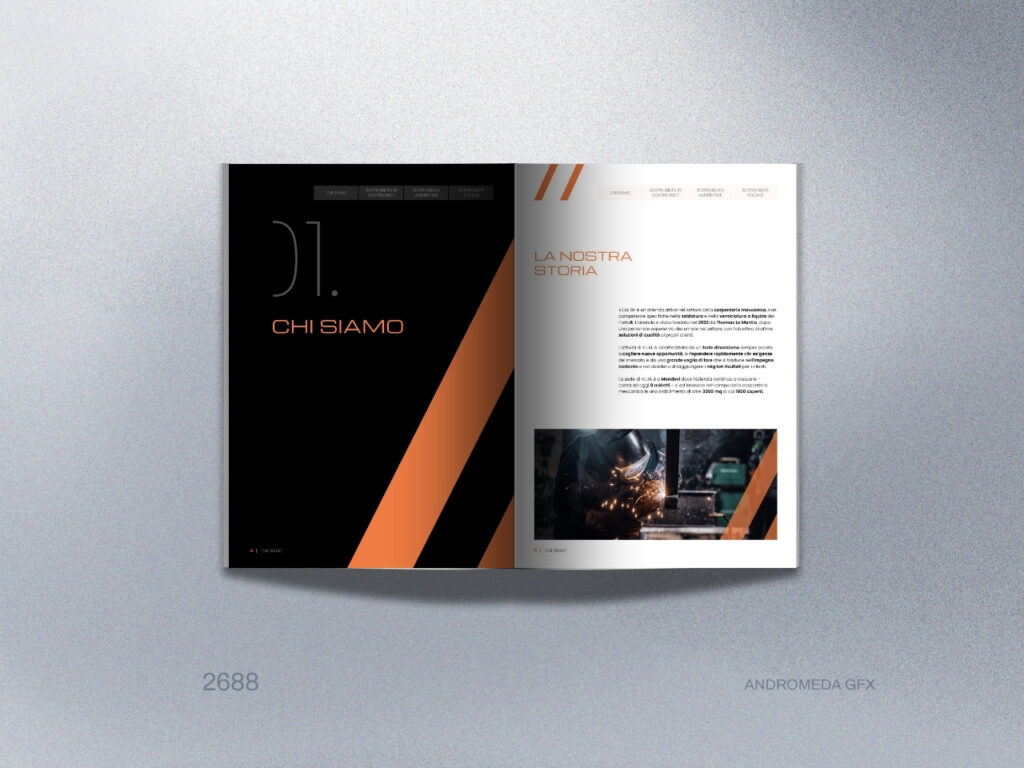
The final deliverable was a complete 2024 sustainability report for V.L.M. SRL, covering environmental, social and governance performance in a structured, branded format.
The finished report combined long-form narrative, corporate photography, data tables, ESG visuals, SDG references and a GRI index, giving the company a stronger and more credible sustainability communication piece.
“Our stakeholders assumed we’d hired a top-tier design agency in-house. The report was shared in board presentations across three countries.”
Client Name
Communications Lead, Corporate Name
Everything authors, firms, and organisations ask us before starting a report project.
We design the full range of corporate and institutional documents: annual reports, financial reports, white papers, market research and intelligence reports, ESG and sustainability reports, impact reports, investor presentations, and government and policy documents.
Whether you're starting from a rough Word draft, a pile of Excel charts, or a finished manuscript that simply needs professional typesetting, we handle layout, data visualisation, infographics, and print-ready file preparation end to end.
Yes. Confidentiality is standard on every project. Your documents, financials, and unpublished data are never shared, reused, or published in our portfolio without your explicit permission.
We're happy to sign an NDA before you send anything over — many of our corporate and institutional clients require one, and we treat it as a normal part of getting started.
We use AI to make our process faster and more efficient — for example, to help recreate charts and graphs from screenshots or raw data, speed up repetitive layout tasks, and shorten turnaround so you get your report sooner.
But the human stays in control of every decision. Our designers do all the creative direction, the eye-for-detail work, and the quality and consistency checks by hand. AI helps us move quickly; it never replaces the design judgement that makes a report look credible.
Yes. For digital reports we can build in accessibility features such as proper reading order, tagged PDF structure for screen readers, sufficient colour contrast, and clear typographic hierarchy.
If your report needs to meet a specific standard — for instance accessibility requirements for public-sector or listed-company documents — let us know up front and we'll design to it from the start.
Absolutely. Alongside print-ready files, we produce interactive PDFs with clickable navigation — a linked table of contents, jump-to-section bookmarks, and clickable links to web pages or email.
We can also build fillable form fields — text inputs, checkboxes, and dropdowns — so your report or an accompanying document can be completed and returned digitally, with no printing required.
Reports are typeset in Adobe InDesign. You receive a press-ready PDF (CMYK, with bleed and embedded fonts) for printing, and a separate optimised digital PDF for screen and web sharing.
On request we can also hand over editable source files or build a reusable template so your team can produce future editions consistently.
It depends on length and complexity, but as a guide: a 60-page white paper takes around two weeks, and a 130+ page annual report with full data-visualisation work takes around four to five weeks.
If you're working to a hard deadline — a board meeting, an AGM, a launch — tell us the date and we'll confirm whether we can meet it before you commit.